About Melbourne Pulse
A zero-cost, open-source civic analytics platform that streams live pedestrian and parking telemetry across Melbourne's CBD, powered by LightGBM machine learning and automated on serverless infrastructure.
Architecture Pipeline
City of Melbourne + Open-Meteo
City of Melbourne Open Data: per-minute pedestrian counts, parking bay sensors and hourly history. Open-Meteo: the weather forecast and observed rain. Both free, no key.
GitHub Actions
Started by cron-job.org: hourly ingest and weather, a daily forecast, a monthly rain-effect measurement. Every job runs its tests before it writes.
Neon Postgres
Sydney region. 0.25 CU serverless compute scaling to zero after 5m. Hourly aggregates only, kept 90 days.
Next.js on Vercel
Server components and three small JSON endpoints read Neon as a read-only role. Cached hourly and refreshed right after each ingest.
City of Melbourne Open Data ─┐                     cron-job.org (hourly :07, daily 04:37)
  pedestrian counts          │                                  │ starts
  parking bay sensors        ├──► GitHub Actions ◄──────────────┘
  hourly history             │      tests (gate)
Open-Meteo ──────────────────┘      hourly   fetch.py, weather_forecast.py, summary.py → Gemini Flash
  weather forecast                  daily    predict.py (LightGBM + weather forecast)
  observed rain                     monthly  rain_effect.py
                                         │ writes                    POST /api/revalidate
                                         ▼                                    │
                                    Neon Postgres ◄── read-only ── Next.js on Vercel ◄─┘
hourly aggregates / /map /plan /aboutForecast Model Benchmark
The model was tested strictly on 8 weeks of unseen test data (2026-08-05 to 2026-09-29) spanning 132,696 sensor-hours across 103 Melbourne counting stations. Its average error is 14% lower than the 8-week typical. It uses the weather forecast as an input: in rainy hours its error is 69.2, against 81.7 for the same model without weather.
| Method | Average Error (MAE, pedestrian counts/hr) | Average % Error (MAPE) |
|---|---|---|
| Seasonal Naive (same hour last week) | 71.5 | 31.6% |
| Typical Baseline (8-week median) | 61.7 | 25.7% |
| LightGBM (Our Model) | 53.2 | 22.3% |
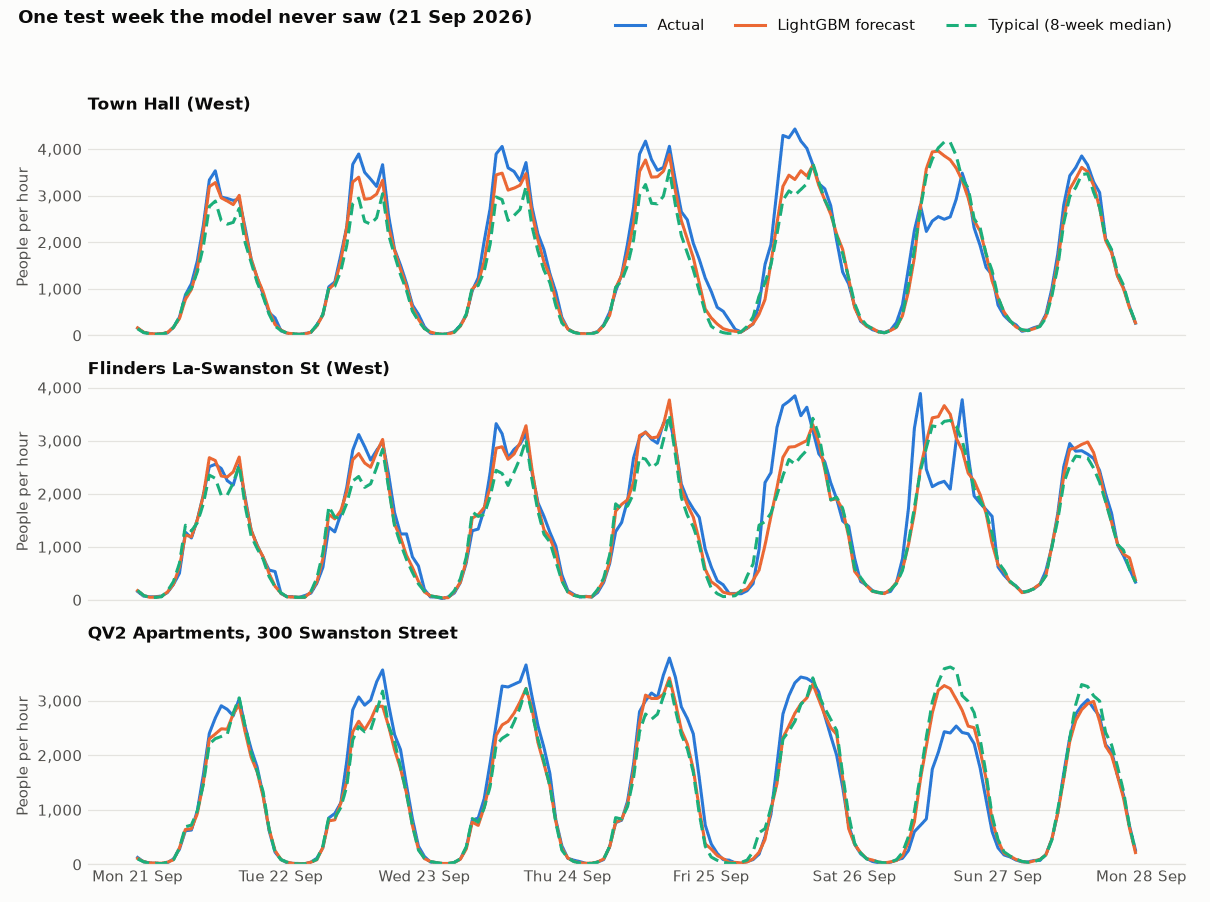
Actual vs LightGBM forecast vs 8-week typical baseline across Town Hall (West), Flinders La-Swanston St, and QV2 Swanston Street.
The Honest Grand Final Friday Note
The test period includes the Victorian public holiday for Friday before the AFL Grand Final. The model correctly identifies calendar public holidays, but because most regular public holidays make the CBD quieter, machine learning models cannot anticipate major unexpected sports parades or surge events that pull thousands of pedestrians into unexpected corridors. That is where our biggest residuals occur.
The Plan Page and What Rain Does
Plan turns the forecast into an answer: the best two hours to be in the CBD for the busiest dry spell, the most foot traffic or the quietest time, for the whole CBD or any one sensor. Each recommendation is picked by fixed rules from the forecast pedestrian counts and the Open-Meteo rain forecast. No language model is involved.
Does the weather forecast help the model?
Yes. On the same 132,696 test sensor-hours, average error fell from 55.3 to 53.2 pedestrian counts an hour, and in rainy hours from 81.7 to 69.2. As a check, the same model given weather from 14 days away scored 55.7 and 81.5: no gain, so the improvement comes from the real weather.
The test weeks had only 125 wet hours, so the rainy-hour figures are less certain than the overall ones.
How much does rain change foot traffic?
In a wet hour, pedestrian counts across the CBD change by −20% (95% interval −23.7% to −16.6%), measured over 892 wet hours from 1 Nov 2025 to 31 Oct 2026. In heavy rain the change is −35.3%.
Each wet hour is compared with dry hours at the same sensor, hour, day type and month. 99 of 102 sensors have a reliable estimate of their own. This explains the forecast; it is never applied to it. Recalculated monthly.
Free-Tier Budget Breakdown
The entire pipeline, model inference, database, and front-end run within the free tiers of Neon, GitHub Actions, cron-job.org, Open-Meteo, Google Gemini, and Vercel.
Neon Storage~40 MB at 90 days
Aggregated hourly records keep storage footprint to ~114 bytes/row. Rows older than 90 days are pruned automatically. 40 MB represents only 8% of Neon's 0.5 GB free limit.
Neon Compute~18 CU-hours / mo
Compute scales to zero after 5 minutes of inactivity. Fixed at 0.25 CU minimum size. Website requests hit the cached ISR layer and do not wake the DB. Uses ~18% of the 100 CU-hour quota.
Data License: Telemetry is sourced from the City of Melbourne Open Data platform under Creative Commons Attribution (CC BY). Weather data by Open-Meteo (CC BY 4.0).
Developed by Rukshan Dias · Data Science, Deakin University. View complete source code, test suites, and model training scripts on GitHub.